Lonnie Lawrence Dennis: His Shocking Role in History After ‘Boy Evangelist’

Posted in Articles, Biography, History, Media Archive, Passing, Politics/Public Policy, Religion, United States on 2019-07-24 00:34Z by Steven

Shocking Role in History After ‘Boy Evangelist’

Lost Buxton: Information about Buxton, Iowa by Rachelle Chase
2019-01-09

Rachelle Chase

Lonnie Lawrence Dennis
Lonnie Lawrence Dennis as a child

“At a revival we used to have, I remember this little boy was preaching,” said Gertrude Stokes, an African American resident of Buxton, Iowa. “He used to wear a little white robe. He ran our revival and that’s when I joined the church.”

The little boy was eight-year-old Lonnie Lawrence Dennis. On November 16, 1902, Lonnie appeared at St. John’s A.M.E. Church in Buxton. To a full house, he preached “The Life of Christ,” after which a long line formed at the altar. At least 50 men, women and children had decided to “follow the story of Christ.”1 Lonnie remained in Buxton for 10 days, where he continued to convert many, like Stokes.

During this time, locals trudged through mud to hear him. Others traveled from surrounding towns, such as Albia, Lovilia and Oskaloosa. Lonnie had become known nationwide and everyone wanted to hear the renowned child evangelist…

…But not only had he ditched his first name, he had apparently ditched his parents and all public references to being black. In 1913, he entered a prestigious prep school, Phillips Exeter Academy, and in 1915 he entered Harvard. After serving briefly in WWI in France, he resumed his studies at Harvard, graduated in 1920, and landed a job with the State Department.

But it was his activities beginning in the 1930s that shocked (and appalled) me—activities that made him “widely known as the most influential person in American fascism”…

Read the entire article here.

Tags: , , , , , ,

The End of the Postracial Myth

Posted in Articles, Barack Obama, Media Archive, Politics/Public Policy, United States on 2016-11-20 00:57Z by Steven

The End of the Postracial Myth

The New York Times Magazine
2016-11-15

Nikole Hannah-Jones

Pundits are quick to say that it couldn’t be about prejudice in states like Iowa, where Obama voters went for Trump. But racial anxiety is always close to the surface — and can easily be stoked.

On a cold, clear night in January 2008, when Iowa Democrats selected Barack Obama over a white woman and a white man in the state’s first-in-the-nation caucus, the moment felt transformative. If voters in this overwhelmingly white, rural state could cast their ballots for a black man as president, then perhaps it was possible for the entire nation to do what had never been done; perhaps America had turned far enough away from its racist past that skin color was no longer a barrier to the highest office of the land. In the months that followed, as Obama racked up primary victories, not just in the expected cities but also in largely white Rust Belt towns and farming communities, it seemed evidence for many Americans that the nation had finally become “post-racial.”

Of course, that post-racial dream did not last long, and nothing epitomizes the naïveté of that belief more than the election last week of Donald J. Trump. As I watched my home state of Iowa join the red flood that overtook the electoral map last Tuesday, I asked myself the same questions that so many others did: What happened? Why had states that reliably backed Obama — states like Iowa, Michigan, Wisconsin and Pennsylvania — flipped Republican?

I was struck by how quickly white pundits sought to tamp down assertions that race had anything to do with it. It was, it seemed to me, almost a relief to many white Americans that Trump’s victory encompassed so many of the heavily white places that voted for a black man just years before. It was an absolution that let them reassure themselves that Donald Trump’s raucous campaign hadn’t revealed an ugly racist rift after all, that in the end, the discontent that propelled the reality-TV star into the White House was one of class and economic anxiety, not racism.

But this analysis reveals less about the electorate than it does about the consistent inability of many white Americans to think about and understand the complex and often contradictory workings of race in this country, and to discuss and elucidate race in a sophisticated, nuanced way.

While we tend to talk about racism in absolute terms — you’re either racist or you’re not — racism and racial anxiety have always existed on a spectrum. For historians who have studied race in the United States, the change from blue to red in heavily white areas is not surprising. In fact, it was entirely predictable. “There are times when working-class whites, whether rural or urban, will join an interracial alliance to get the short-term gains they want,” Robin Kelley, a history professor at U.C.L.A., told me. “They don’t ever do it without kicking and screaming.”…

Read the entire article here.

Tags: , , , , , , ,

What is “White”?

Posted in Articles, Census/Demographics, Media Archive, United States, Videos on 2016-10-02 00:47Z by Steven

What is “White”?

#EmergingUS: Exploring race, immigration and the emerging American identity
2016-09-26

In an increasingly diverse country, White Americans are an emerging racial minority. #EmergingUS travelled to one of the Whitest states, Iowa, to ask Iowans what it means to be White in a changing America.

Hosted by Jose Antonio Vargas, the founder of #EmergingUS and the producer/director of the MTV special White People, this video is a first in a series that explores White identity in the #EmergingUS.

Read the transcript here.

Tags: , ,

Let Ohio Vote First

Posted in Articles, Census/Demographics, Media Archive, Politics/Public Policy, United States on 2016-02-16 18:43Z by Steven

Let Ohio Vote First

The New York Times
2016-02-16

Emma Roller

We, as voters and election-obsessed bystanders, made it past the first two contests in this eons-long presidential primary, but seven candidates weren’t so lucky.

The winnowed-down field has now moved on to the warmer vote-seeking climes of Nevada and South Carolina. Before moving on too, I’d like to consider what this election has now proven: Iowa and New Hampshire’s first-in-the-nation status is not only obsolete, it’s bad for our democratic process.

Ask people in Iowa or New Hampshire to justify their lock on early voting, and you hear this: “It’s cheap to campaign here.” “We take this job seriously.” “It’s part of our political heritage.” It can turn into a sort of Zen koan: We matter because we’re first, and we’re first because we matter. Inconveniently for them, none of these justifications are good enough.

That’s why, to help save our democracy, I would like to autocratically declare Ohio as the new first-in-the-nation primary state starting in 2020. It might not be a perfect idea, but it would be a lot better than our system now.

The main problem with Iowa and New Hampshire is a demographic one. Put simply, they are too white. Both states’ populations are roughly 90 percent white, while the United States population as a whole is 62 percent white. The United States is projected to become a minority-white country in roughly 30 years. This is where Ohio comes in

Read the entire article here.

Tags: , , , , ,

President Obama & Marilynne Robinson: A Conversation in Iowa

Posted in Articles, Barack Obama, Interviews, Literary/Artistic Criticism, Politics/Public Policy, United States on 2015-11-27 01:16Z by Steven

President Obama & Marilynne Robinson: A Conversation in Iowa

The New York Review of Books
2015-11-05

President Barack Obama

Marilynne Robinson


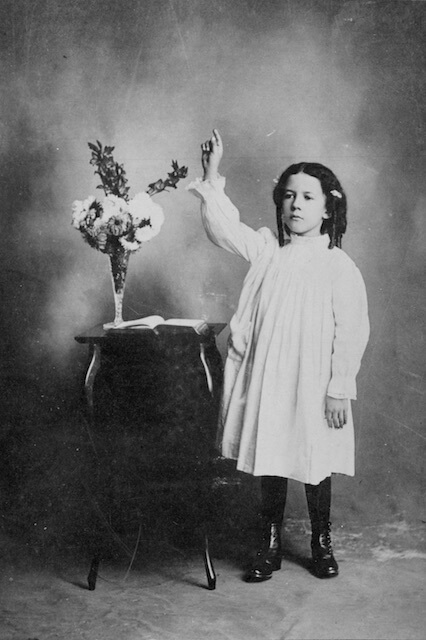
President Obama and Marilynne Robinson at the Iowa State Library, Des Moines, September 2015 (Pete Souza/White House)

The following conversation between President Obama and Marilynne Robinson was conducted in Des Moines, Iowa, on September 14. An audio recording of it can be heard at itunes.com/nybooks. —The Editors

The President: Marilynne, it’s wonderful to see you. And as I said as we were driving over here, this is an experiment, because typically when I come to a place like Des Moines, I immediately am rushed over to some political event and I make a speech, or I have a town hall, or I go see some factory and have wonderful conversations with people. But it’s very planned out and scripted. And typically, we’re trying to drive a very particular message that day about education or about manufacturing.

But one of the things that I don’t get a chance to do as often as I’d like is just to have a conversation with somebody who I enjoy and I’m interested in; to hear from them and have a conversation with them about some of the broader cultural forces that shape our democracy and shape our ideas, and shape how we feel about citizenship and the direction that the country should be going in.

And so we had this idea that why don’t I just have a conversation with somebody I really like and see how it turns out. And you were first in the queue, because—

Marilynne Robinson: Thank you very much.

The President: Well, as you know—I’ve told you this—I love your books. Some listeners may not have read your work before, which is good, because hopefully they’ll go out and buy your books after this conversation.

I first picked up Gilead, one of your most wonderful books, here in Iowa. Because I was campaigning at the time, and there’s a lot of downtime when you’re driving between towns and when you get home late from campaigning. And you and I, therefore, have an Iowa connection, because Gilead is actually set here in Iowa…

Robinson: And also, one of the things that doesn’t take into account is that local governments can be great systems of oppression. And it’s a wonderful thing to have a national government that can intervene in the name of national values.

The President: Well, that was the lesson of the entire movement to abolish slavery and the civil rights movement. And that’s one thing—I mean, I do think that one of the things we haven’t talked about that does become the fault line around which the “us” and “them” formula rears its head is the fault line of race. And even on something like schools that you just discussed, part of the challenge is that the school systems we have are wonderful, except for a handful of schools that are predominantly minority that are terrible.

Our systems for maintaining the peace and our criminal justice systems generally work, except for this huge swath of the population that is incarcerated at rates that are unprecedented in world history.

And when you are thinking about American democracy or, for that matter, Christianity in your writings, how much does that issue of “the other” come up and how do you think about that? I know at least in Gilead that factors into one major character, trying to figure out how he can love somebody in the Fifties that doesn’t look like him.

Robinson: Iowa never had laws against interracial marriage. Only Iowa and Maine never had [them]—

The President: Those were the only two.

Robinson: Yes. And [Ulysses S.] Grant really did call [Iowa] the shining star of radicalism, and so on. We never had segregated schools; they were illegal from before, while it was still a territory, and so on. And these laws never changed and they became the basis for the marriage equality ruling that the Supreme Court here [in Iowa] did.

So that whole stream of the culture never changed. And at the same time, the felt experience of the culture was not aligned with the liberal tradition [of the] culture. And so in that book, Jack has every right to think he can come to Iowa, and yet what he finds makes him frightened even to raise the question…

Read the entire conversation here. Read part 2 of the conversation here.

Tags: , , ,

Civil War memorial to honor Toolesboro brothers

Posted in Articles, History, Media Archive, United States on 2014-10-14 00:08Z by Steven

Civil War memorial to honor Toolesboro brothers

The Cedar Rapids Gazette
Iowa City, Iowa
2014-09-23

Alison Gowans, Features Reporter

LOUISA COUNTY, Iowa — When the six Littleton brothers of tiny Toolesboro set off for war, their sisters had no idea they would never welcome their brothers home.

The young Louisa County men all sacrificed their lives fighting for the North in the Civil War.

Their story, which was lost to history until a few years ago, is remarkable in many ways, said Tom Woodruff, a member of the Louisa County Historical Society.

“As far as we know, it’s the largest loss of life in one immediate family in any U.S. war,” he said. “It’s pretty significant.”

Woodruff stumbled on the tale in a scrapbook of Louisa County newspaper clippings dated 1846 to 1906. Brothers Thomas, William, George, John, Kendall and Noah all enlisted and died from wounds, disease or other calamities during the war.

Woodruff and other members of the Historical Society have been working to research and honor the brothers’ stories, starting with a booklet they published in 2012.

Now, the Louisa County Board of Supervisors has donated a plot of vacant land in Toolesboro, on the Great River Road adjacent to the Toolesboro Indian Mounds, as a site for a permanent memorial to the Littleton family’s sacrifice.

“It’s very close to where these boys were raised,” Woodruff said. “It’s a great spot, an appropriate spot.”…

…In the 1860 census, they are listed as mulatto, a term used at the time to indicate mixed race. Records show mother Martha was white and father James was mulatto. They settled in Iowa with the help of abolitionists, Woodruff said. The Littleton brothers joined all-white units when they enlisted.

“Iowa knows how to accept a family into their midst regardless of race, regardless of background, and those people in turn contribute to the freedoms we have in the United States,” Woodruff said. “They were ordinary boys who sacrificed their lives for us. Iowa raised those boys and they gave back a lot.”…

Read the entire article here.

Tags: , , , , , , , ,

Iowa memorial for six brothers who died as Union soldiers

Posted in Articles, History, Media Archive, United States on 2014-10-13 23:07Z by Steven

Iowa memorial for six brothers who died as Union soldiers

The Washington Post
2014-05-07

Linda Wheeler

A site was approved Tuesday for a memorial to honor six brothers of an African American farm family of Toolesboro, Iowa, who died as Union soldiers during the Civil War.

The Louisa County Board of Supervisors choose a site near the tiny crossroads community where the brothers were raised in southeast Iowa on the Illinois border.

In 1840, James and Martha Littleton moved from Maryland, via Ohio, to Iowa where they raised their nine children including three girls. In the1860 census, the family is identified as mulatto, a term used during that time period to mean they were of mixed race. Research determined Martha was white and her husband, James, was mulatto.

The men served in white military units, volunteering between 1861 and 1862. By 1864, all had died—some in battle and others from disease– and were buried far from home…

Read the entire article here.

Tags: , , , , , ,

More Iowans identifying as mixed race

Posted in Articles, Campus Life, Census/Demographics, Identity Development/Psychology, Media Archive, United States on 2011-04-26 02:36Z by Steven

More Iowans identifying as mixed race

The Daily Iowan
The Independent Daily Newspaper for the University of Iowa Since 1868
2011-04-19

Alison Sullivan

Photo: Christy Aumer/The Daily IowanSophomore Tevin Robbins poses in the window of the second floor at the Afro-American Cultural Center on April 5. Robbins is currently majoring in psychology but has switched his major from engineering to better accompany other areas of his life. 

University of Iowa student Tevin Robbins sat lounging on the couch at the UI’s Latino Native American Cultural Center with friend, Michael Harbravison, on a Friday evening.

Robbins’ light coffee-crème complexion is juxtaposed by his hair — a thick, rusty-red mass sitting on top of his head.

“I don’t even know what type of skin color I am,” Robbins said. The 19-year-old, part Cherokee, African American, and white, makes the statement not out of confusion but merely the inability to choose.

Robbins is one among an increasing number of Iowans who identify as more than one ethnicity, according to data from the 2010 U.S. Census released in March. The number is still small—fewer than 2 percent of Iowans identified themselves as more than one race—but it is a 68 percent jump from 2000.

Growing up for Robbins was difficult because of his complexion. Too light, he said, to pass as African American, but dark enough to not pass as white. He never felt accepted in any one “group.”

“Why do I have to choose to identify as something?” he said. “I’m not one ethnicity.”

The 2010 census was the first time researchers were able to use the comparable data. In Johnson County, there has been a 77 percent increase. And at the University of Iowa, 223 students identified as two or more ethnicities in the fall of 2010—an increase from the 133 students in 2009, when the UI first began collecting such data.

Overall, the census shows a 60 percent increase in minorities in Iowa.

“This is a group whose choices have changed,” said Mary Campbell, a UI associate professor of sociology.

Campbell said roughly 40 years ago, people who had more than one ethnicity faced the pressures to identify with a single one, but now, social change has eased such constraints…

Read the entire article here.  View the slideshow here.

Tags: , , ,

Census Bureau Reports Final 2010 Census Data for the United States

Posted in Articles, Census/Demographics, Louisiana, Media Archive, Mississippi, Texas, United States, Virginia on 2011-03-25 02:15Z by Steven

Census Bureau Reports Final 2010 Census Data for the United States

United States Census Bureau
Census 2010
2011-03-24

The U.S. Census Bureau announced today that 2010 Census population totals and demographic characteristics have been released for communities in all 50 states, the District of Columbia and Puerto Rico. These data have provided the first look at population counts for small areas and race, Hispanic origin, voting age and housing unit data released from the 2010 Census. With the release of data for all the states, national-level counts of these characteristics are now available.

For each state, the Census Bureau will provide summaries of population totals, as well as data on race, Hispanic origin and voting age for multiple geographies within the state, such as census blocks, tracts, voting districts, cities, counties and school districts.

According to Public Law 94-171, the Census Bureau must provide redistricting data to the 50 states no later than April 1 of the year following the census. As a result, the Census Bureau is delivering the data state-by-state on a flow basis. All states will receive their data by April 1, 2011.

Highlights by Steven F. Riley

  • The United States population (for apportionment purposes)  is 308,745,538. This represents a 9.71% increase over 2000.
  • The U.S. population including Puerto Rico is 312,471,327.  This represents a 9.55% increase over 2000.
  • The number of repondents (excluding Puerto Rico) checking two or more races (TOMR) is 9,009,073 or 2.92% of the population. This represents a 31.98% increase over 2000.
  • The number of repondents (including Puerto Rico) checking TOMR is 9,026,389 or 2.89% of the population.  This represents a 29.23% increase over 2000.
  • Hawaii has the highest TOMR response rate at 23.57%, followed by Alaska (7.30%), Oklahoma (5.90%) and California (4.87%).
  • California has the highest TOMR population at 1,815,384, followed by Texas (679,001), New York (585,849), and Florida (472,577).
  • Mississppi has the lowest TOMR response rate at 1.15%, followed by West Virginia (1.46%),  Alabama (1.49%) and Maine (1.58%).
  • Vermont has the lowest TOMR population at 10,753, followed by North Dakota (11,853), Wyoming (12,361) and South Dakota (17,283).
  • South Carolina has the highest increase in the TOMR response rate at 100.09%, followed by North Carolina (99.69%), Delaware (83.03%) and Georgia (81.71%).
  • New Jersey has the lowest increase in the TOMR response rate at 12.42%, followed by California (12.92%), New Mexico (16.11%), and Massachusetts (17.81%).
  • Puerto Rico has a 22.83% decrease in the TOMR response rate and New York has a 0.73% decrease in the TOMR response race.  No other states or territories reported decreases.
2010 Census Data for “Two or More Races” for States Above
# State Total Population Two or More Races (TOMR) Percentage Total Pop. % Change from 2000 TOMR % Change from 2000
1. Louisiana 4,533,372 72,883 1.61 1.42 51.01
2. Mississippi 2,967,297 34,107 1.15 4.31 70.36
3. New Jersey 8,791,894 240,303 2.73 4.49 12.42
4. Virginia 8,001,024 233,400 2.92 13.03 63.14
5. Maryland 5,773,552 164,708 2.85 9.01 59.00
6. Arkansas 2,915,918 72,883 2.50 9.07 59.50
7. Iowa 3,046,355 53,333 1.75 4.10 67.83
8. Indiana 6,483,802 127,901 1.97 6.63 69.02
9. Vermont 625,741 10,753 1.71 2.78 46.60
10. Illinois 12,830,632 289,982 2.26 3.31 23.38
11. Oklahoma 3,751,351 221,321 5.90 8.71 41.89
12. South Dakota 814,180 17,283 2.12 7.86 70.18
13. Texas 25,145,561 679,001 2.70 20.59 31.93
14. Washington 6,724,540 312,926 4.65 14.09 46.56
15. Oregon 3,831,074 144,759 3.78 11.97 38.20
16. Colorado 5,029,196 172,456 3.43 16.92 41.14
17. Utah 2,763,885 75,518 2.73 23.77 60.01
18. Nevada 2,700,551 126,075 4.67 35.14 64.96
19. Missouri 5,988,927 124,589 2.08 7.04 51.82
20. Alabama 4,779,736 71,251 1.49 7.48 61.28
21. Hawaii 1,360,301 320,629 23.57 12.28 23.63
22. Nebraska 1,826,341 39,510 2.16 6.72 64.95
23. North Carolina 9,535,483 206,199 2.16 18.46 99.69
24. Delaware 897,934 23,854 2.66 14.59 83.03
25. Kansas 2,853,118 85,933 3.01 6.13 52.10
26. Wyoming 563,626 12,361 2.19 14.14 39.15
27. California 37,253,956 1,815,384 4.87 9.99 12.92
28. Ohio 11,536,504 237,765 2.06 1.59 50.59
29. Connecticut 3,574,097 92,676 2.59 4.95 23.82
30. Pennsylvania 12,702,379 237,835 1.87 3.43 67.23
31. Wisconsin 5,686,986 104,317 1.83 6.03 55.94
32. Arizona 6,392,017 218,300 3.42 24.59 48.98
33. Idaho 1,567,582 38,935 2.48 21.15 52.04
34. New Mexico 2,059,179 77,010 3.74 13.20 16.11
35. Montana 989,415 24,976 2.52 9.67 58.78
36. Tennessee 6,346,105 110,009 1.73 11.54 74.32
37. North Dakota 672,591 11,853 1.76 4.73 60.22
38. Minnesota 5,303,925 125,145 2.36 7.81 51.25
39. Alaska 710,231 51,875 7.30 13.29 51.92
40. Florida 18,801,310 472,577 2.51 17.63 25.58
41. Georgia 9,687,653 207,489 2.14 18.34 81.71
42. Kentucky 4,339,367 75,208 1.73 7.36 77.20
43. New Hampshire 1,316,470 21,382 1.62 6.53 61.81
44. Michigan 9,883,640 230,319 2.33 -0.55 19.70
45. Massachusetts 6,547,629 172,003 2.63 3.13 17.81
46. Rhode Island 1,052,567 34,787 3.30 0.41 23.14
47. South Carolina 4,625,364 79,935 1.73 15.29 100.09
48. West Virginia 1,852,994 27,142 1.46 2.47 71.92
49. New York 19,378,102 585,849 3.02 2.12 -0.73
50. Puerto Rico 3,725,789 122,246 3.28 -2.17 -22.83
51. Maine 1,328,361 20,941 1.58 4.19 65.58
52. District of Columbia 601,723 17,316 2.88 5.19 71.92
Total (with Puerto Rico) 312,471,327 9,026,389 2.89 9.55 29.23
U.S. Population 308,745,538 9,009,073 2.92 9.71 31.98

Tables compiled by Steven F. Riley. Source: United States Census Bureau

2000 Census Data for “Two or More Races” for States Above
# State Total Population Two or More Races (TOMR) Percentage
1. Louisiana 4,469,976 48,265 1.08
2. Mississippi 2,844,658 20,021 0.74
3. New Jersey 8,414,250 213,755 2.54
4. Virginia 7,078,515 143,069 2.02
5. Maryland 5,296,486 103,587 1.96
6. Arkansas 2,673,400 35,744 1.34
7. Iowa 2,926,324 31,778 1.09
8. Indiana 6,080,485 75,672 1.24
9. Vermont 608,827 7,335 1.20
10. Illinois 12,419,293 235,016 1.89
11. Oklahoma 3,450,654 155,985 4.52
12. South Dakota 754,844 10,156 1.35
13. Texas 20,851,820 514,633 2.47
14. Washington 5,894,121 213,519 3.62
15. Oregon 3,421,399 104,745 3.06
16. Colorado 4,301,261 122,187 2.84
17. Utah 2,233,169 47,195 2.11
18. Nevada 1,998,257 76,428 3.82
19. Missouri 5,595,211 82,061 1.47
20. Alabama 4,447,100 44,179 0.99
21. Hawaii 1,211,537 259,343 21.41
22. Nebraska 1,711,263 23,953 1.40
23. North Carolina 8,049,313 103,260 1.28
24. Delaware 783,600 13,033 1.66
25. Kansas 2,688,418 56,496 2.10
26. Wyoming 493,782 8,883 1.80
27. California 33,871,648 1,607,646 4.75
28. Ohio 11,353,140 157,885 1.39
29. Connecticut 3,405,565 74,848 2.20
30. Pennsylvania 12,281,054 142,224 1.16
31. Wisconsin 5,363,675 66,895 1.25
32. Arizona 5,130,632 146,526 2.86
33. Idaho 1,293,953 25,609 1.98
34. New Mexico 1,819,046 66,327 3.65
35. Montana 902,195 15,730 1.74
36. Tennessee 5,689,283 63,109 1.11
37. North Dakota 642,200 7,398 1.15
38. Minnesota 4,919,479 82,742 1.68
39. Alaska 626,932 34,146 5.45
40. Florida 15,982,378 376,315 2.35
41. Georgia 8,186,453 114,188 1.39
42. Kentucky 4,041,769 42,443 1.05
43. New Hampshire 1,235,786 13,214 1.07
44. Michigan 9,938,444 192,416 1.94
45. Massachusetts 6,349,097 146,005 2.30
46. Rhode Island 1,048,319 28,251 2.69
47. South Carolina 4,012,012 39,950 1.00
48. West Virginia 1,808,344 15,788 0.87
49. New York 18,976,457 590,182 3.11
50. Puerto Rico 3,808,610 158,415 4.16
51. Maine 1,274,923 12,647 0.99
52. District of Columbia 572,059 13,446 2.35
Total (with Puerto Rico) 285,230,516 6,984,643 2.45
  United States 281,421,906 6,826,228 2.43

Tables compiled by Steven F. Riley.  Source: United States Census Bureau

Tags: , , , , , , , , , , , , , , , , , , , , , , , , , , , , , , , , , , , , , , , , , , , , , , ,